Logs
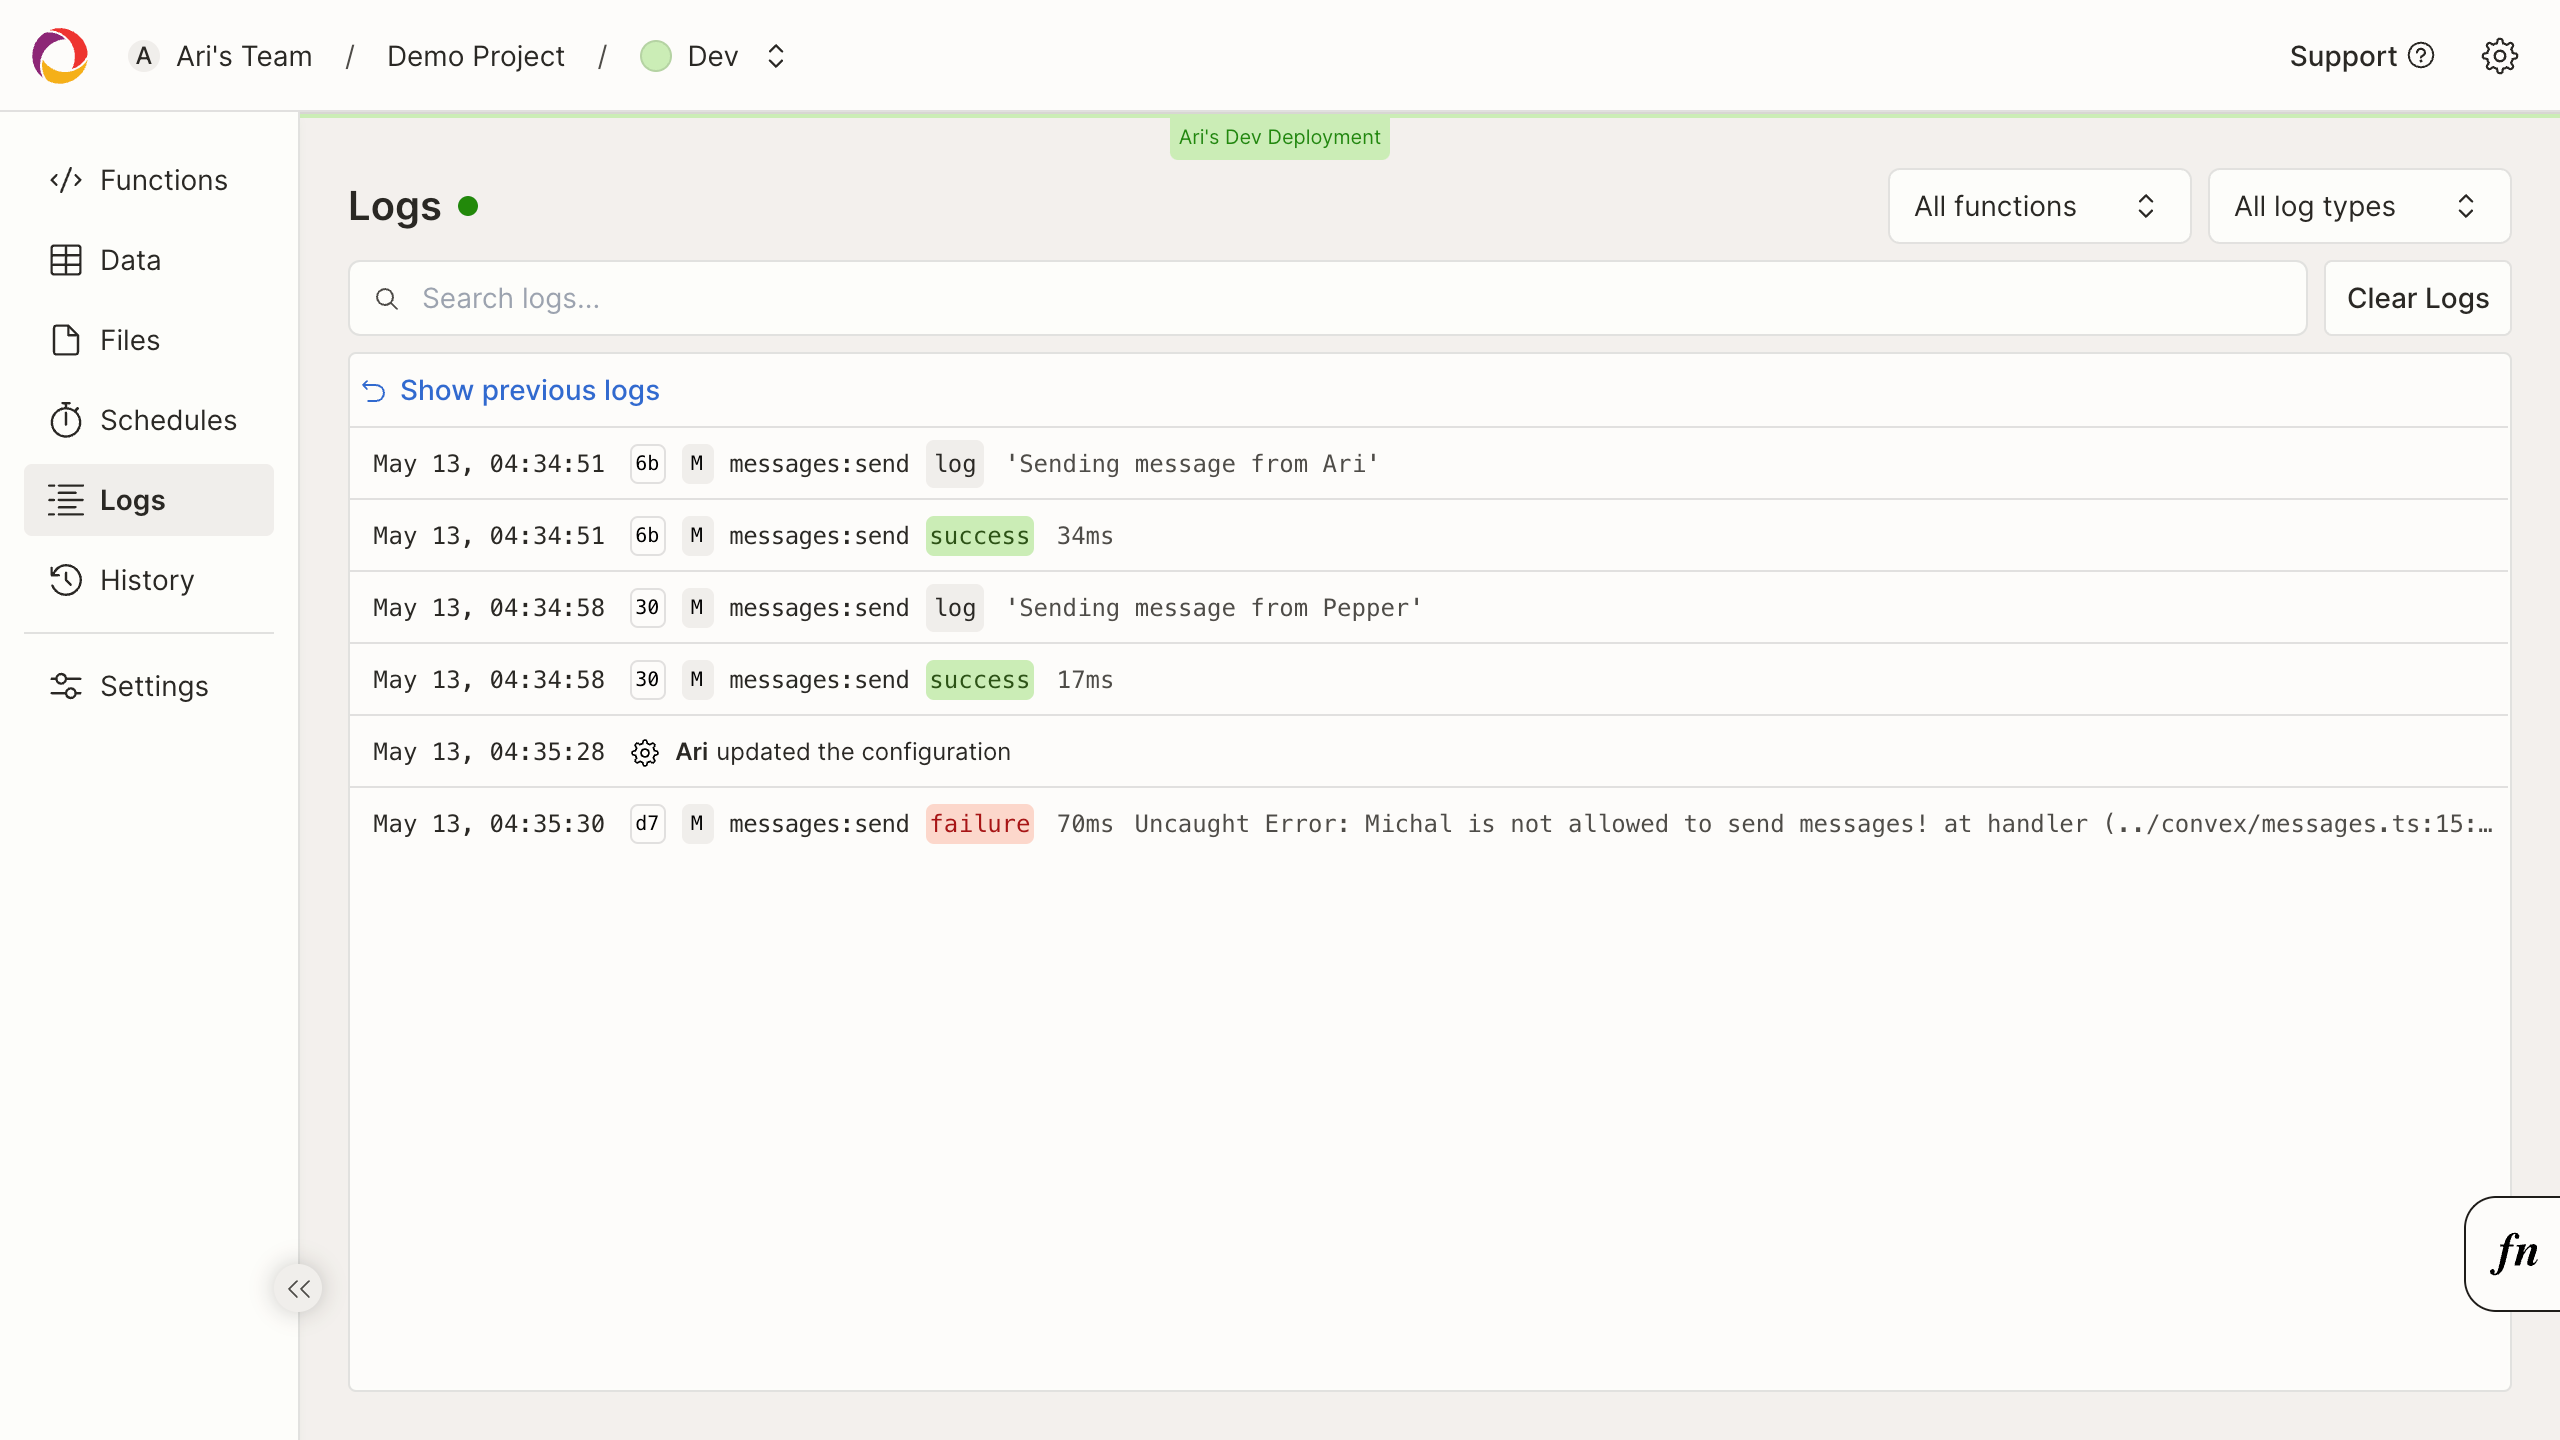
The logs page is a realtime view of all activity that occurs within your deployment.
The logs page provides a short history of recent function logs, and will display new logs as they are generated. To store a longer history of logs, you may configure a log stream.
Function activity includes:
- The time of function execution.
- The request ID of the function execution.
- The outcome of the function execution (success or failure).
- The name of the invoked function.
- The output of the function, including any log lines logged by the function (ex
console.log) and exceptions. - The duration of function execution, in milliseconds (does not include network latency).
In addition to function activity, deployment events describing configuration changes will be present here.
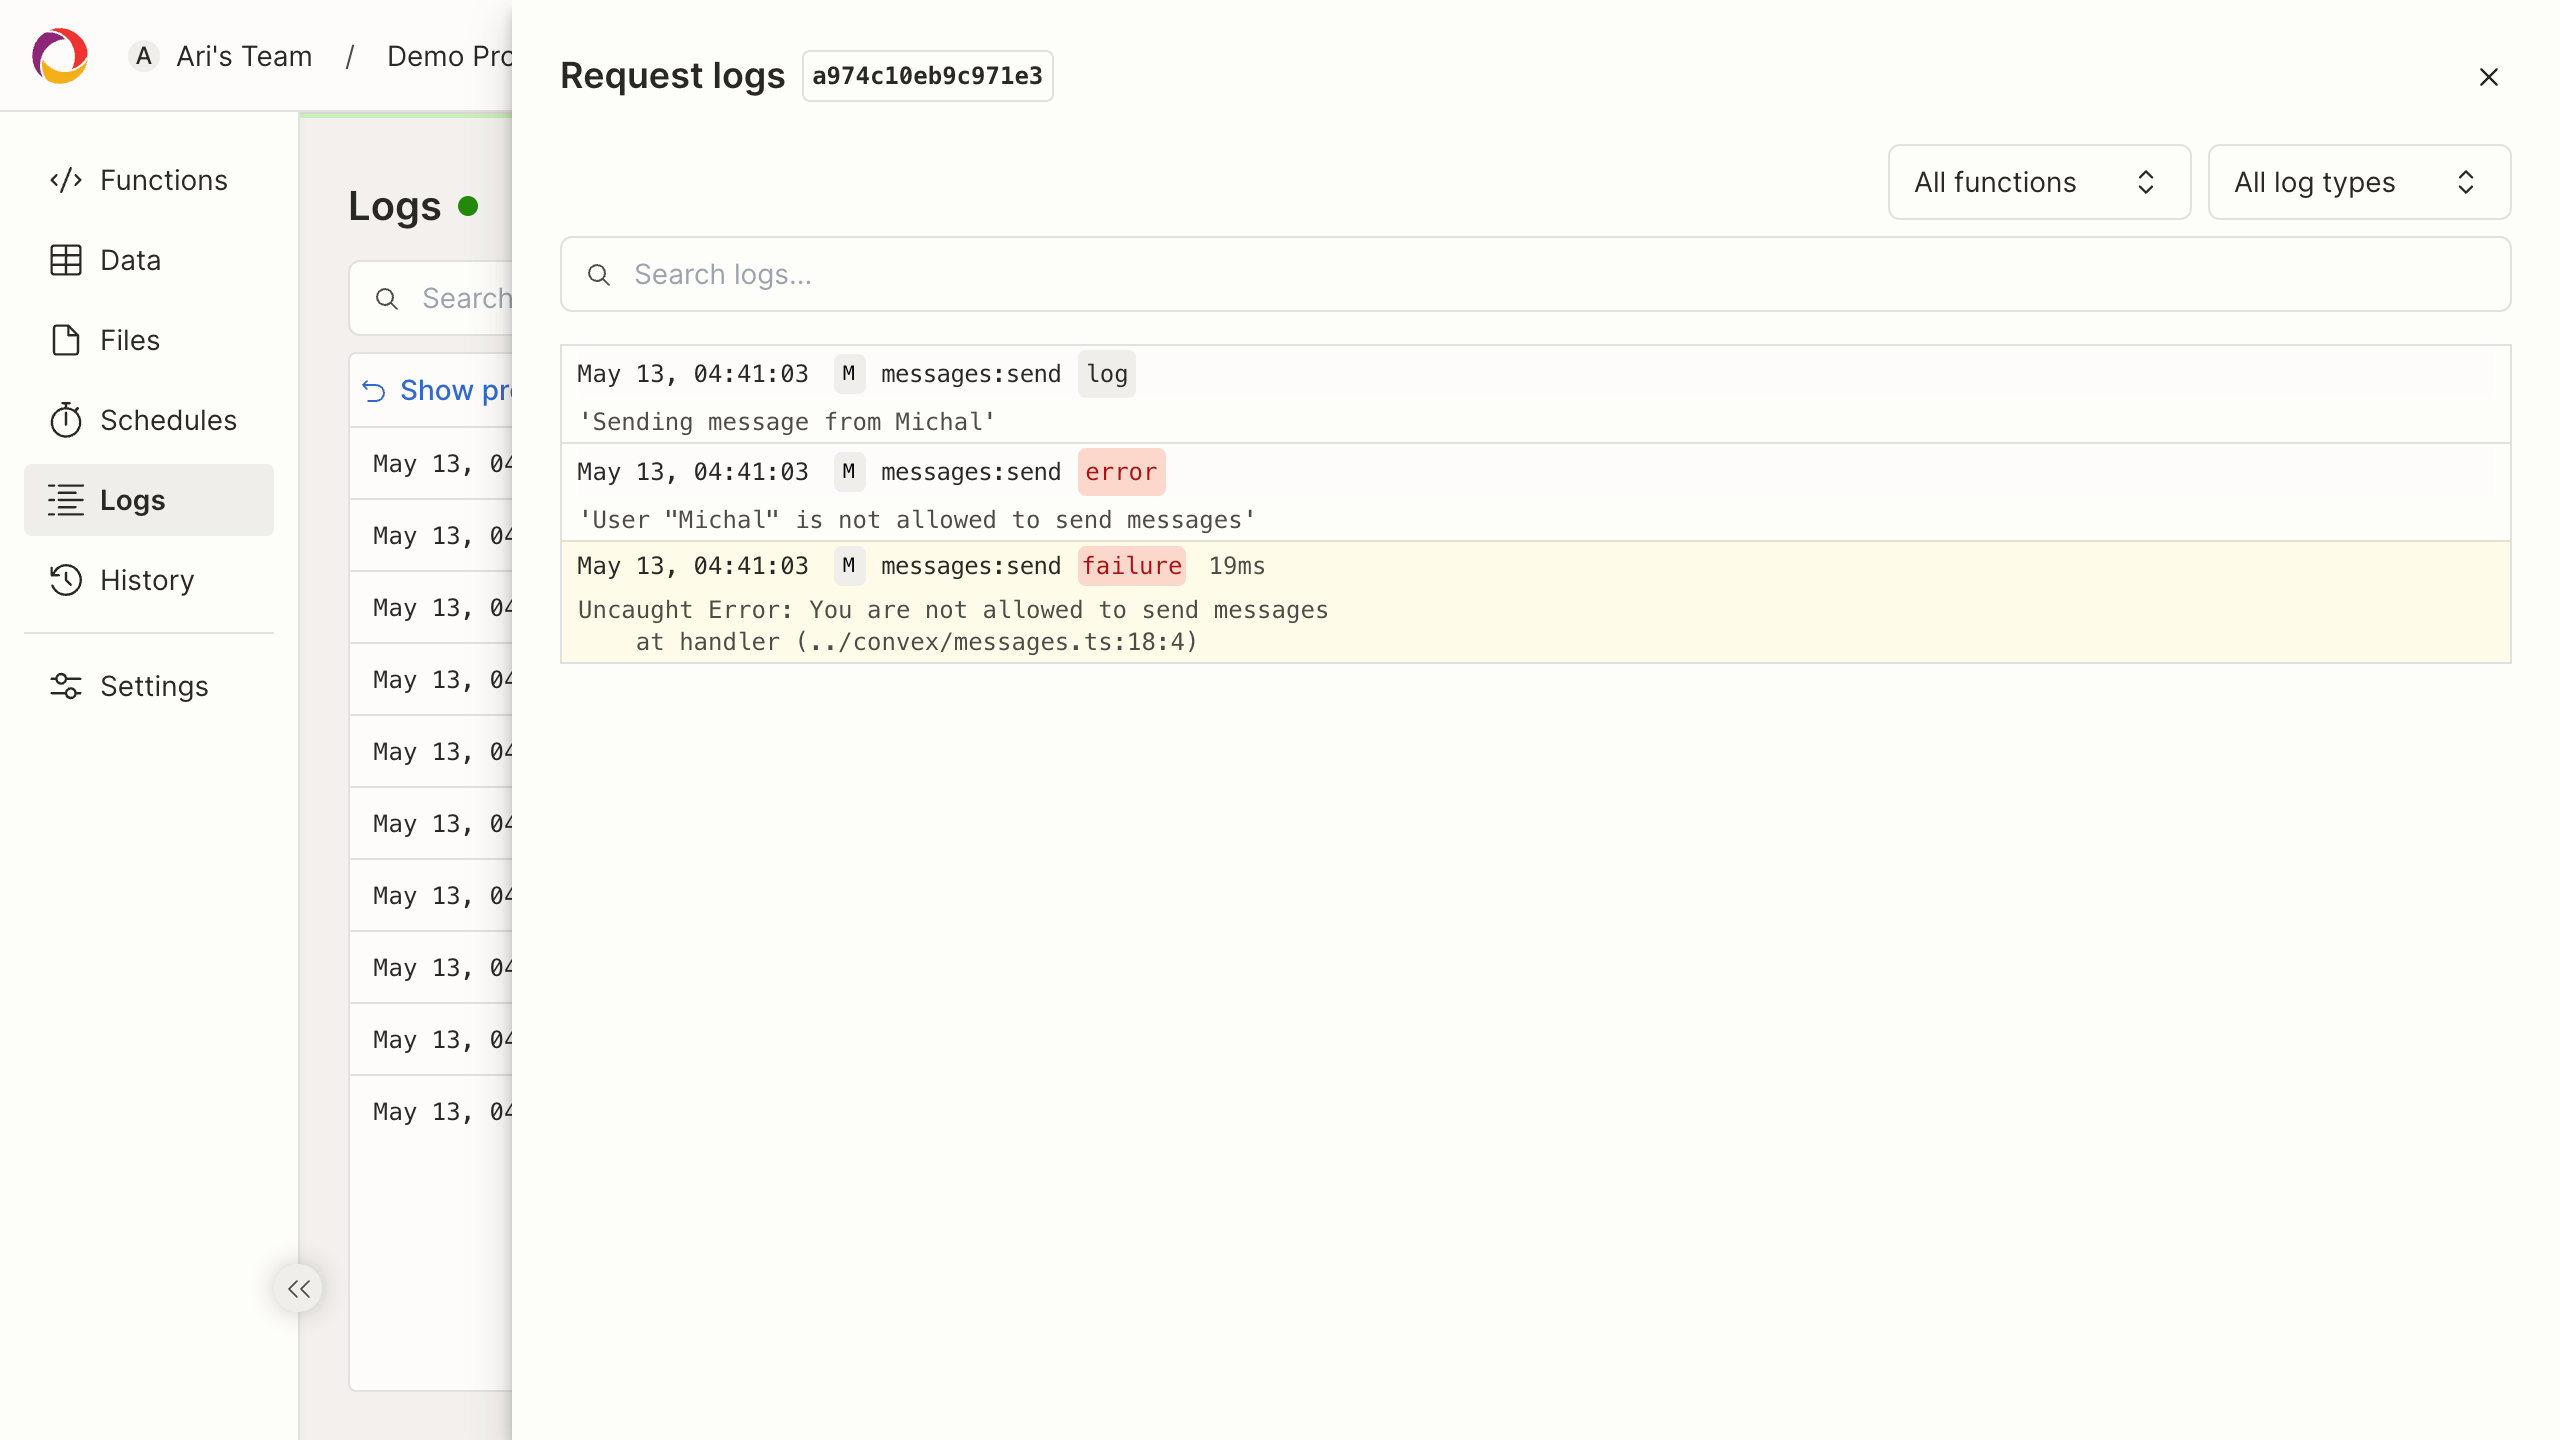
Clicking on log will open a view for all logs associated with the same Request ID as the selected log. This can be useful for debugging errors and understanding the context of a function execution.
You can use controls on the top of this page to filter logs by text, function name, execution status, and log severity.
Filter logs
Use the "Filter logs..." text box on the top of the page to filter log text.
You can use the “Functions” drop-down list to include or exclude functions from the results.
You can also find logs for a particular error using "Filter logs" and the
Convex request id.
For example if you see this Error in your browser console:

You can view the logs for that function in your dashboard by pasting that Request ID into the 'Search logs...' search bar on the Logs page of your Convex dashboard. Note that because this page is not a complete historical view of logs, you may not find logs for older requests.
Most error reporting services and log sinks should also be searchable by Request ID.
Log Types
Logs can also be filtered by type. Types include function outcomes (success or failure) and severity levels (info, warn, debug, error).
All failed executions will include a reason, which will usually be a JavaScript exception.