Functions
The functions page shows all currently deployed Convex functions.
For dev deployments, these are updated continuously by
npx convex dev. The functions for production
deployments are registered with
npx convex deploy.
Running functions
To run a Convex function in the dashboard, select a function from the list on the left-hand side of the page, and click the "Run Function" button that appears next to the function's name.
If you're not on the functions page, you can still open this UI via the persistent fn button shown on the bottom right of all deployment pages. The keyboard shortcut to open the function runner is Ctrl + ` (backtick).
This view allows you to fill out the arguments for your function and run it.
Query results will update automatically as you modify function arguments and data changes.
Mutation and action results will be visible once you click the "Run" button.
Note that these results will show the logs and value returned from the function. To see what changed when you ran your function, see the data page.
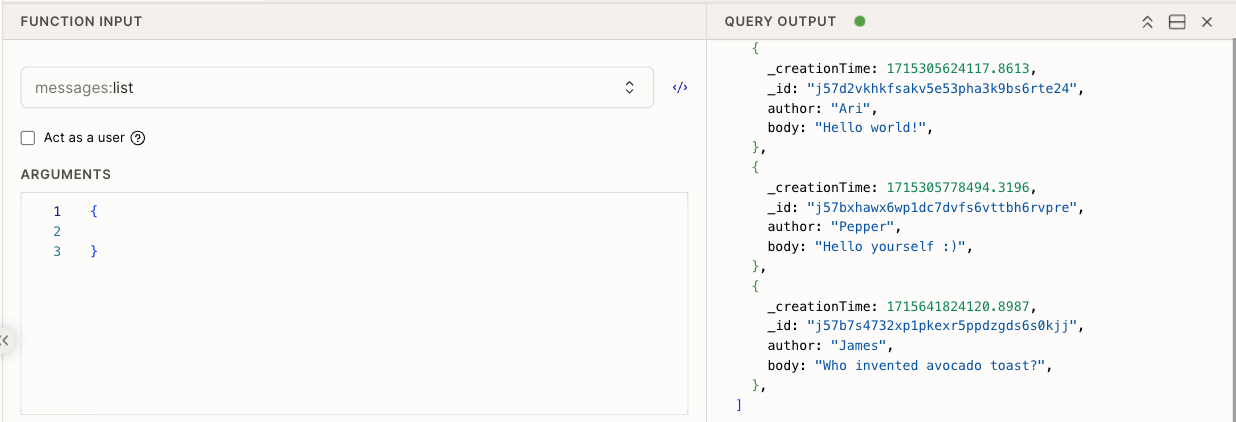
You can also write a custom query function by choosing the “Custom test query“ option instead of one of your deployed functions.
Querying a paginated function
When querying a paginated function in the dashboard, the UI will expect the
arguments to include
PaginationOptions -- i.e. an
object containing the numItems field, and optionally the cursor field. The
name of this argument should be the same as the name defined in your query
function.
numItemsshould be the number of items to include in a pagecursorcan be left blank to begin pagination. Once you receive results, you may setcursorto the result'scontinueCursorfield to proceed to the next page.
Assuming a user identity
Assuming a user identity in the Convex dashboard does not give you access to a real user identity. Instead, this concept can be thought of as "mocking" a user identity into your function.
If you're building an authenticated application, you may want to run a Convex function while acting as an authenticated user identity.
To do so, check the "Act as a user" box.
From there, you can type in the box that appears to fill out the user identity object.
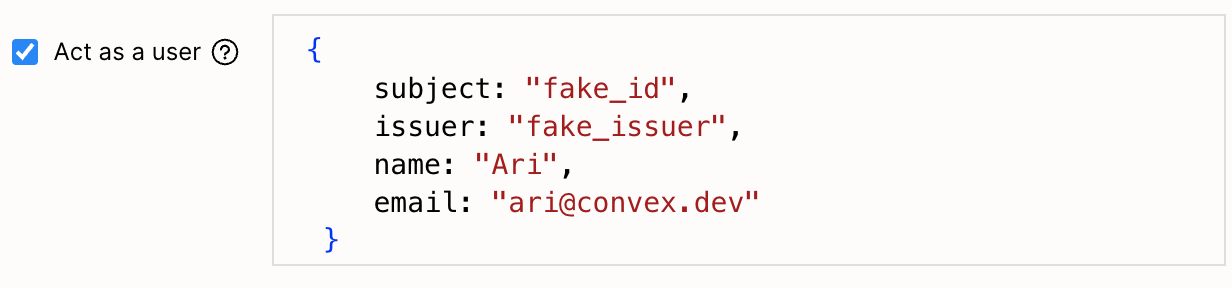
The valid user attributes are:
| Attribute | Type |
|---|---|
| subject* | string |
| issuer* | string |
| name | string |
| givenName | string |
| familyName | string |
| nickname | string |
| preferredUsername | string |
| profileUrl | string |
| string | |
| emailVerified | boolean |
| gender | string |
| birthday | string |
| timezone | string |
| language | string |
| phoneNumber | string |
| phoneNumberVerified | boolean |
| address | string |
| updatedAt | string (in the form of an RFC 3339 date) |
| customClaims | object |
*These attributes are required.
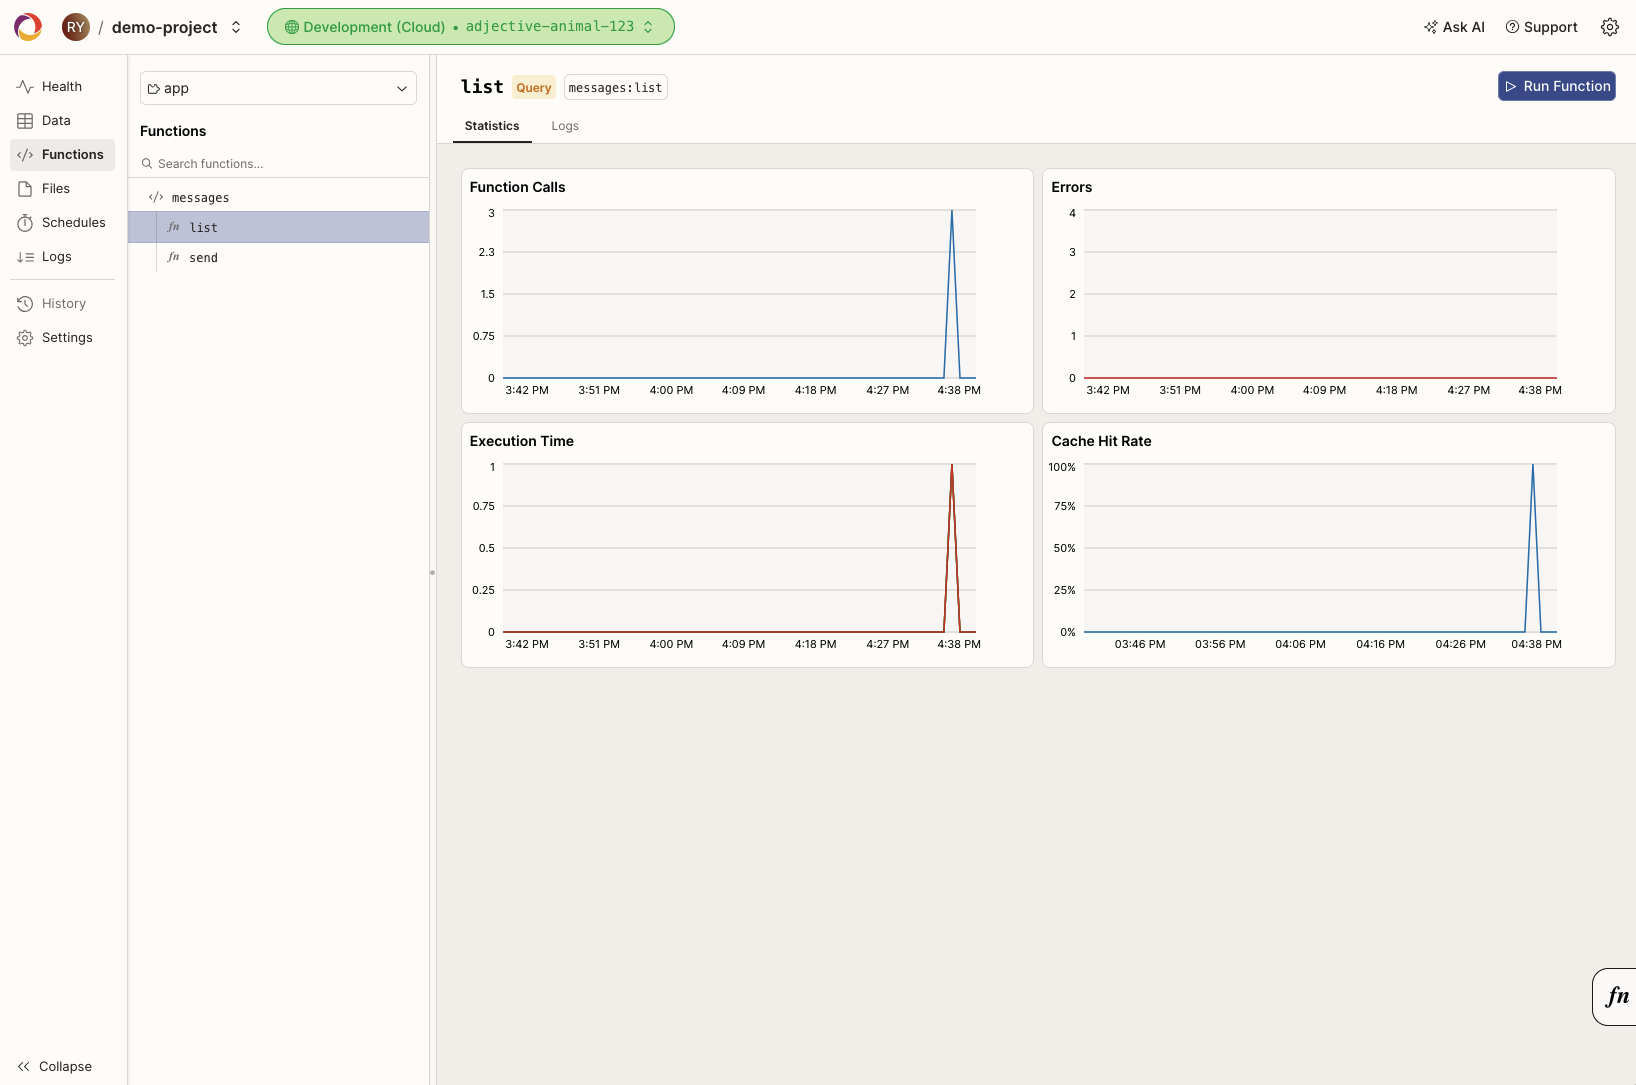
Metrics
There are four basic charts for each function. For overall team usage metrics, see team settings.
Invocations
This chart plots the number of times your function was called per minute. As your app's usage increases, you should see this chart trend upward as well.
Errors
A plot of any exceptions that occur while running your function. Want to know what's going wrong? Check out the logs page, detailed below.
Cache Hit Rate
Cache hit rate only applies to query functions
A percentage rate of how often this function is simply reusing a cached value vs. being rerun. Your application will run best and your response times will be fastest with high cache hit rates.
Execution Time
How long, in milliseconds, this function is taking to run.
There are four individual lines plotted on this chart, p50, p90, p95, and p99. Each of these lines represents the response time for that percentile in the distribution of hits over time. So, only 1% of requests took longer to run than the time shown by the p99 line. Typically, keeping an eye on these tail latencies is a good way to make sure your application is getting data services quickly.
Consider the relationship of the execution time to the cache hit rate. As a rule, a cache hit takes well under 1 ms, so the higher your cache hit rate, the better your response times will be.