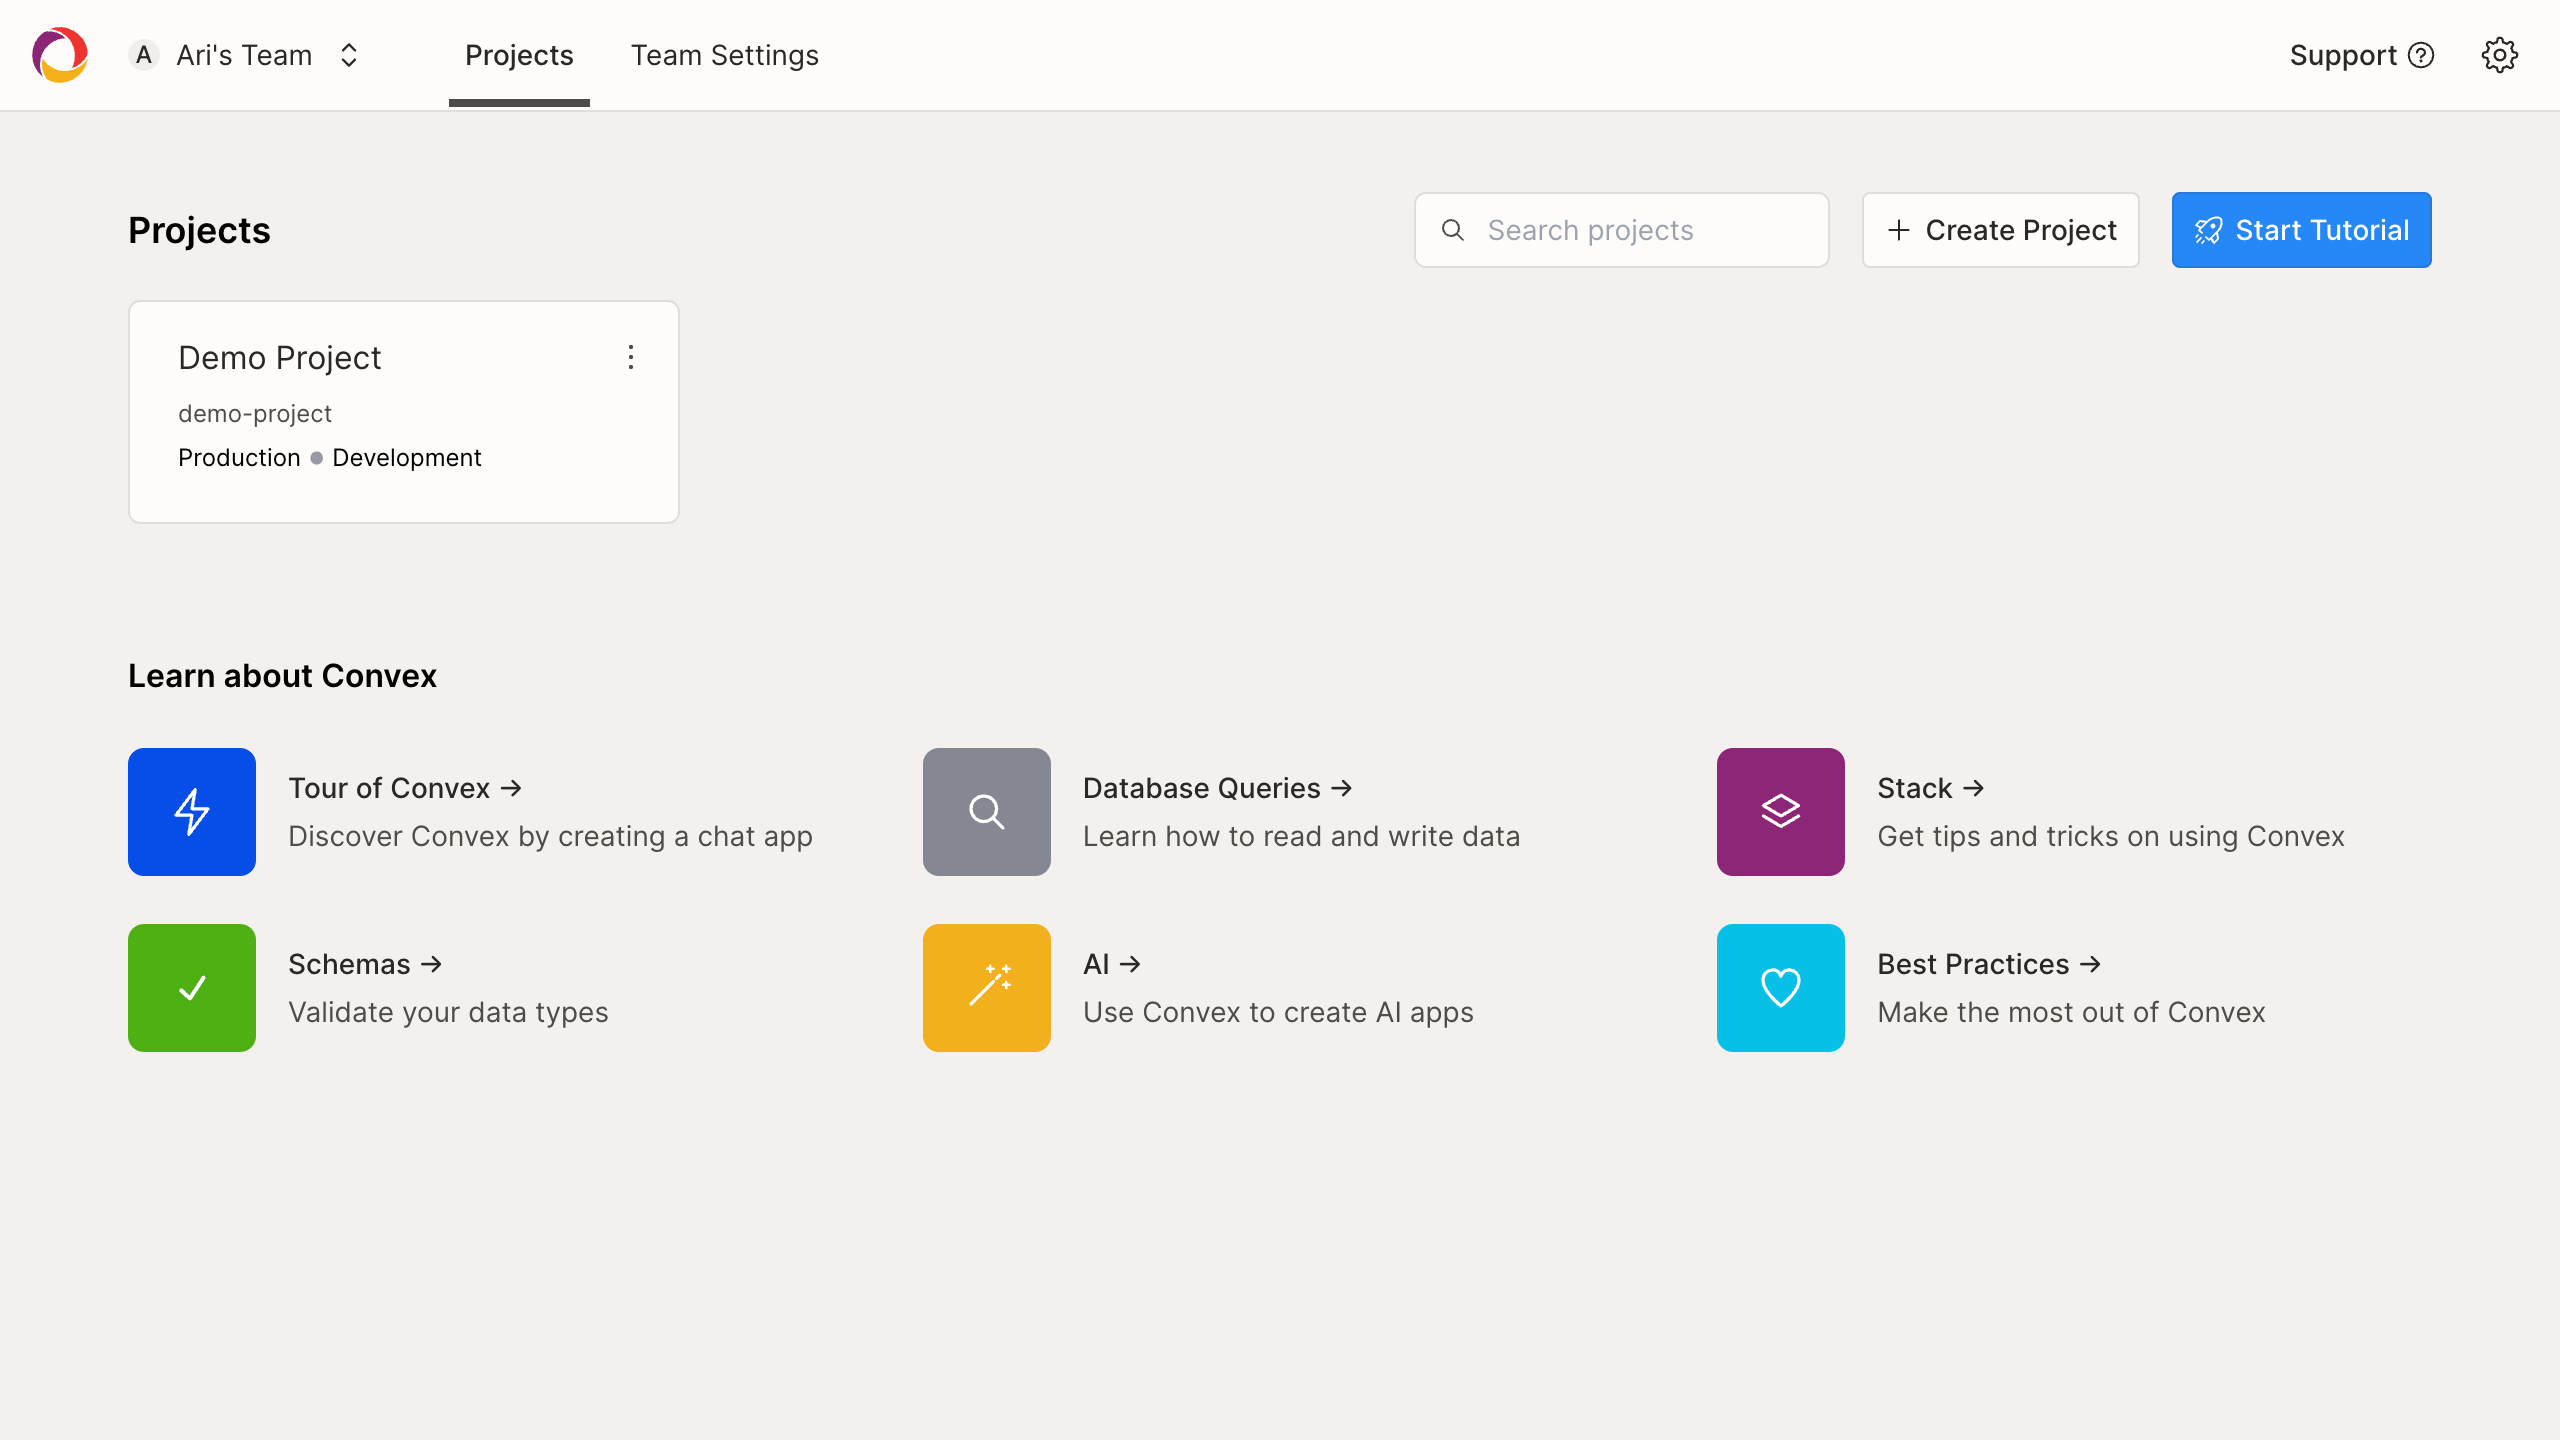
Dashboard
The dashboard shows all of your Convex projects, allowing you to view associated data and debug issues.
Teams
In Convex, your projects are organized by team. Teams are used to share access to your projects with other people. You may switch between teams or create a new team by clicking on the team switcher located on the top-left corner of the Convex dashboard.
You may change the name of a team or invite new members to a team by clicking on the Settings navigation button while on the dashboard landing page.
Projects
A project corresponds to a codebase that uses Convex, which contains a production deployment and one dev deployment for each team member.
Clicking on a project in the landing page will redirect you to project details.
Project Settings
You can access project-level settings by clicking on the Project Settings navigation tab located on the top of the page.
On this page, you'll find:
- A form to update your project's name and slug.
- Instructions to regain access to your project, should you lose track of your
convex.json
file. - A button to permanently delete the project.
Deployments
While on a project page, you may switch between your dev deployment and production by using the dropdown menu on the top-left of the page.
Functions view
The default view for a
deployment shows all currently deployed Convex functions.
For dev deployments, these are updated continuously by
npx convex dev
. The functions
for production deployments are registered with
npx convex deploy
.
There are four basic charts for each function:
Invocations
This chart plots the number of times your function was called per minute. As your app's usage increases, you should see this chart trend upward as well.
Errors
A plot of any exceptions that occur while running your function. Want to know what's going wrong? Check out the logs page, detailed below.
Cache Hit Rate
A percentage rate of how often this function is simply reusing a cached value vs. being rerun. Your application will run best and your response times will be fastest with high cache hit rates.
Note that mutation functions (functions which write to your Convex tables) will never be cached, so for mutations this chart will always be pinned at 0%.
Execution Time
How long, in milliseconds, this function is taking to run.
There are four individual lines plotted on this chart, p50, p90, p95, and p99. Each of these lines represents the response time for that percentile in the distribution of hits over time. So, only 1% of requests took longer to run than the time shown by the p99 line. Typically, keeping an eye on these tail latencies is a good way to make sure your application is getting data services quickly.
Consider the relationship of the execution time to the cache hit rate. As a rule, a cache hit takes well under 1 ms, so the higher your cache hit rate, the better your response times will be.
Clicking on any of the charts will give you a larger, detailed view where you can customize the time ranges you're inspecting.
Scheduled Jobs
You can view all scheduled invocations for the function you are currently viewing. You can click to see a more detailed view, including function arguments, as well as cancel all or individual scheduled calls.
Running functions
To run a Convex function in the dashboard, select a function from the list on the left-hand side of the page, and click the "Run function" button that appears next to the function's name.
This screen allows you to provide arguments for your function (in the order they are defined in code), as well as view the results of your function.
Query results will update automatically as data changes and you modify function arguments.
Mutation and action results will be visible once you click the "Run" button. Note that these results will show the value returned from the function. To see what changed when you ran your function, see the data view.
Querying a paginated function
When querying a paginated function in the dashboard, the UI will expect the
first argument to be the
PaginationOptions
type -- i.e. an
object containing the numItems
field, and optionally the cursor
field.
numItems
should be the number of items to include in a pagecursor
can be left blank to begin pagination. Once you receive results, you may setcursor
to the result'scontinueCursor
field to proceed to the next page.
Assuming a user identity
Assuming a user identity in the Convex dashboard does not give you access to a real user identity. Instead, this concept can be thought of as "mocking" a user identity into your function.
If you're building an authenticated application, you may want to run a Convex function while acting as an authenticated user identity.
To do so, check the "Act as a user" box.
From there, you can type in the box that appears to fill out the user identity object.
The valid user attributes are:
Attribute | Type |
---|---|
tokenIdentifier | string (in the form of "issuer|subject") |
name | string |
givenName | string |
familyName | string |
nickname | string |
preferredUsername | string |
profileUrl | string |
string | |
emailVerified | boolean |
gender | string |
birthday | string |
timezone | string |
language | string |
phoneNumber | string |
phoneNumberVerified | boolean |
address | string |
updatedAt | string (in the form of an RFC 3339 date) |
Data view
The data view provides insight into your current tables and the documents contained within each of those tables.
On the left side of the window is a list of your tables. Clicking on an individual table will drill down into a layout that allows you to peruse the documents within that table.
Filtering documents
You may filters documents on the data page by clicking the "Filter" button on the top of the page.
All fields in a document are filterable by the operations supported in Convex query syntax. Equality and Comparison when filtering in the dashboard share the same rules as a query using the Convex client.
To add a filter, click "Add condition" in the filter selection menu. If you add
more than one condition, they will be evaluated using the and
operation.
For each filter, you must select a field to filter by, operation, and comparison
value. In the third input box (selecting a value), you may enter a valid Convex
value, such as "a string"
, 123
, or even a complex object, such as
{ a: { b: 2 } }
When filtering by _creationTime
, a date picker will be displayed instead of
the normal JavaScript syntax input box. Comparisons for _creationTime
are made
at the nanosecond granularity, so if you'd like to filter to an exact time, try
adding two filter conditions for creationTime >= $time
and
creationTime <= $time + 1 minute
.
Creating tables
You may create a table from the dashboard by clicking the "Create table" button and entering a new name for the table.
Convex does not currently support deleting tables (however, you can remove all documents from a table).
Creating documents
The dashboard currently supports editing all Convex types except Sets, Maps, and Bytes.
You may add individual documents to the table using the "Add document" button located in the data table's toolbar.
Once you click "Add document" a side panel will open prompting you to select a type and value for each existing field, and optionally add additional fields that do not already exist in the table.
Editing a cell
To edit a value, double-click on a cell in the data table.
You can change the value by editing inline, or click on the pencil icon to open an advanced editor, allowing you to change the data type.
Editing a document
To edit multiple values in a document at the same time, hover over the row and click the button that appears on the right hand side.
You may also edit the entire document using JavaScript syntax by enabling the "Edit as Javascript" checkbox at the top of the panel.
Adding references to other documents
To add an ID reference to your document, add a column with the "object" type and use the ID constructor syntax to reference an ID. If the ID is valid, hovering the ID will indicate which document is being referenced.
The syntax to reference an ID is: new Id("TABLE_NAME", "ID_STRING")
Deleting documents
To selectively delete documents from a table, hover over and click on the "_id" cell of a document row to select it. When at least one document is selected, the "Delete documents" button will be visible in the table toolbar.
Clicking "Delete documents" will open a prompt to confirm deletion.
Clearing a table
Clearing table data is irreversible. The Convex dashboard will have you type in the name of the selected deployment and table before clearing a table.
The "Clear Table" button at the top of the detail view will delete all data from
the table for the selected deployment. This action is equivalent to the
TRUNCATE TABLE
in a SQL database.
Generating a schema
At the bottom-left of the view is a "Generate Schema" button which you can click to have Convex generate a schema of all your documents within this table.
Indexes
The "Indexes" button at the top of the detail view will list all of the Indexes associated with the selected table. Indexes that have not completed backfilling will be accompanied by a loading spinner next to their name.
File Storage
The "File Storage" button above your tables in the data view will drill down to a view of the files stored in your deployment. From here, you can see your existing files, their storage IDs, size, and content type. On this page, you can upload new files and download or delete existing files. You may choose to reference storage objects in a table by saving their "Storage ID" in a document within a table.
Logs view
The logs view is a realtime view of all activity that occurs within your deployment.
Function activity includes:
- The time of function execution.
- The outcome of the function execution (success or failure).
- The name of the invoked function.
- The output of the function, including any log lines logged by the function (ex
console.log
) and exceptions. - The duration of function execution, in milliseconds (does not include network latency).
In addition to function activity, deployment events describing configuration changes will be present here.
You can use controls on the left-hand side of this page to filter logs by text, function name, execution status, and log severity.
Text filter
Use the "Filter" text box on the top of the controls to filter by the name of the function or log text.
Status
The status of a log entry indicates whether the Convex function succeeded or failed. All failed executions will include a reason, which will usually be a JavaScript exception.
Log Levels
The log level filter will control which log lines are included in the logs page. If a Convex function execution does not contain a log line matching the level filter, it will be omitted from the results. The "No log lines" filter controls whether executions with no console output are included in the results.
History view
This history view is an audit log of configuration-related events that have occurred in the selected deployment, such as function deployments, changes to indexes, and changes to environment variables.
Deployment Settings view
This settings page gives you access to information and configuration options related to a specific deployment (Production or your personal Development environments).
Here, you'll find:
- The URL this deployment is hosted at. Some Convex integrations may require the deployment URL for configuration.
- The deployment's deploy key, used to integrate with build tools such as Netlify and Vercel and syncing data with Airbyte.
- The deployment's data export snapshots.
- The deployment's environment variables.